Integrating Splunk with Razorsharp for Enhanced .NET Monitoring
Setting Up Splunk in Docker for .NET Applications
Begin the integration of Splunk with Razorsharp by setting up Splunk within a Docker container. This setup is optimal for experimentation and real-time monitoring, accommodating environments using Windows for log storage and Linux for the Splunk container.
Pull the latest Splunk image with Docker:
docker pull splunk/splunk:latestStart your Splunk container:
docker run -d -p 8000:8000 -e SPLUNK_START_ARGS='--accept-license' -e SPLUNK_PASSWORD='YourPassword' -v D:/splunk:/var/log/razorsharp --name splunk splunk/splunk:latestThis initial setup prepares Splunk to receive and analyze logs from your .NET applications using Razorsharp.
Configuring Data Sources in Splunk
Once Splunk is running, configure it to monitor and analyze .NET application logs effectively:
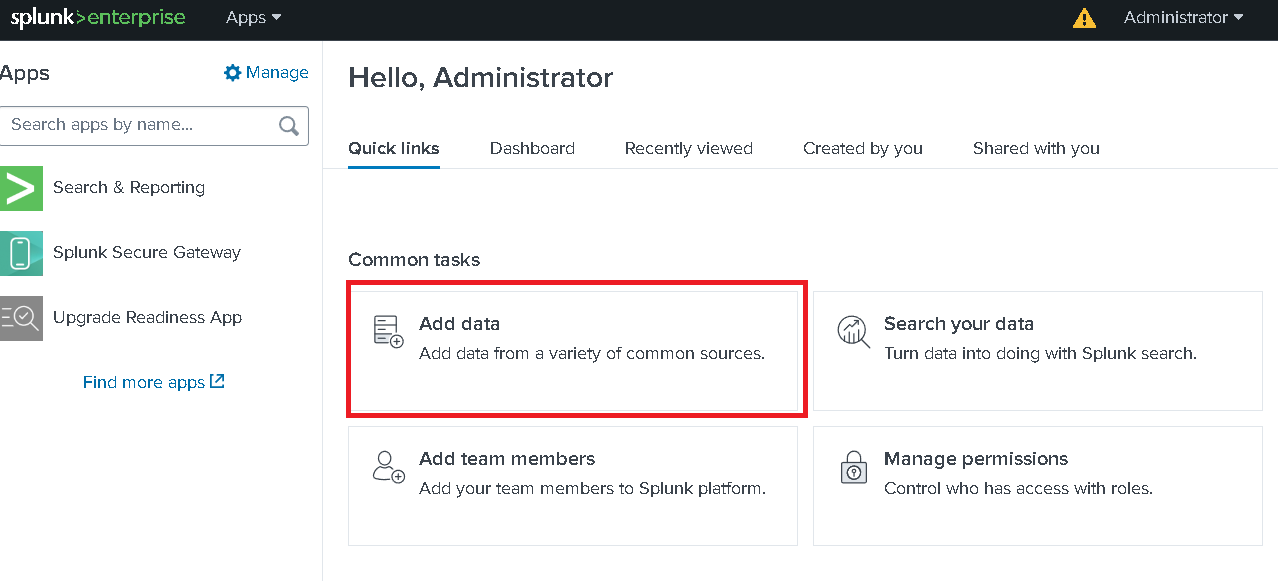
- Access your Splunk dashboard: Visit http://localhost:8000.
- Add Data: Navigate to the 'Add Data' option to begin configuring your data inputs.
- Monitor Local Files: Choose 'Monitor' and then 'Files and Directories' to specify which logs to analyze.
- Specify Log Directory: Enter '/var/log/razorsharp' as the directory to monitor.
- Select Data Format: Choose '_json' as the source type for structured logging.
This configuration allows Splunk to process and visualize critical performance metrics from Razorsharp-monitored applications.

Triggering and Capturing Logs with Razorsharp
Integrate logging into your development workflow by configuring your .NET project to send logs to Splunk:
<DockerfileRunArguments>-v "D:\splunk:/var/log/razorsharp"</DockerfileRunArguments>Update your Dockerfile to include commands that install Razorsharp and configure it to intercept and log application data:
# Install Razorsharp APM CLI tool and run it
RUN dotnet tool install Razorsharp.APM.CLI --global --version 1.0.0-beta*
ENV PATH="${PATH}:/root/.dotnet/tools"
RUN razorsharp --inject /app/publish/HelloWorld.dll
These steps ensure that all interactions within your application are logged and available for analysis in Splunk.
Analyzing Logs with Splunk Search Queries
Utilize Splunk’s powerful search and query features to analyze the performance and security metrics of your .NET applications:
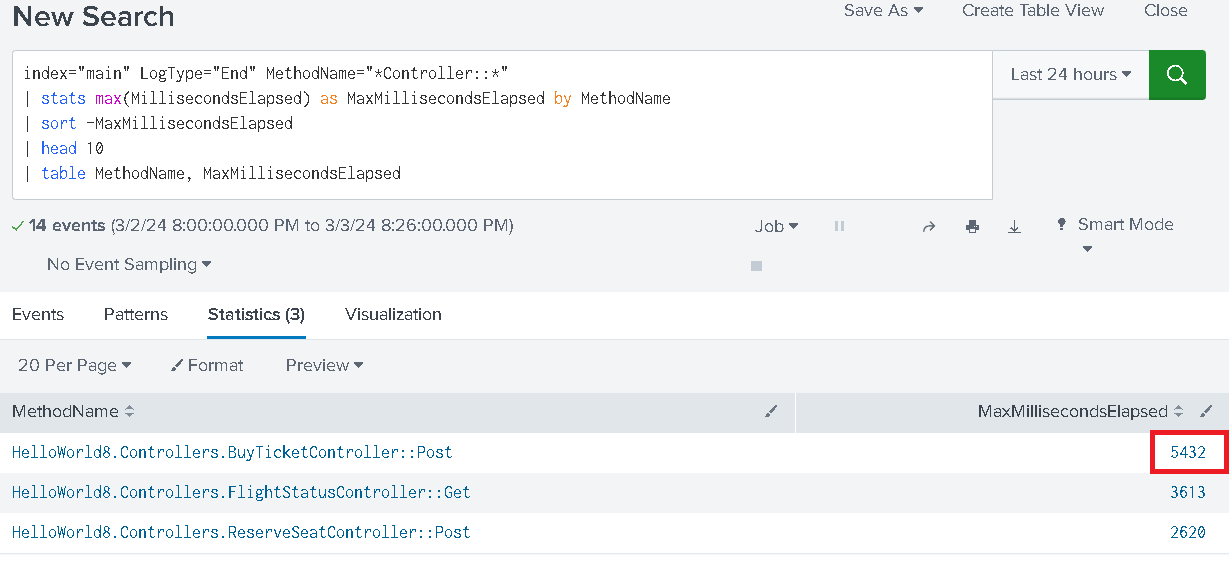
index="main" LogType="End" MethodName="*Controller::*"
| stats max(MillisecondsElapsed) as MaxMillisecondsElapsed by MethodName
| sort -MaxMillisecondsElapsed
| head 10
| table MethodName, MaxMillisecondsElapsed
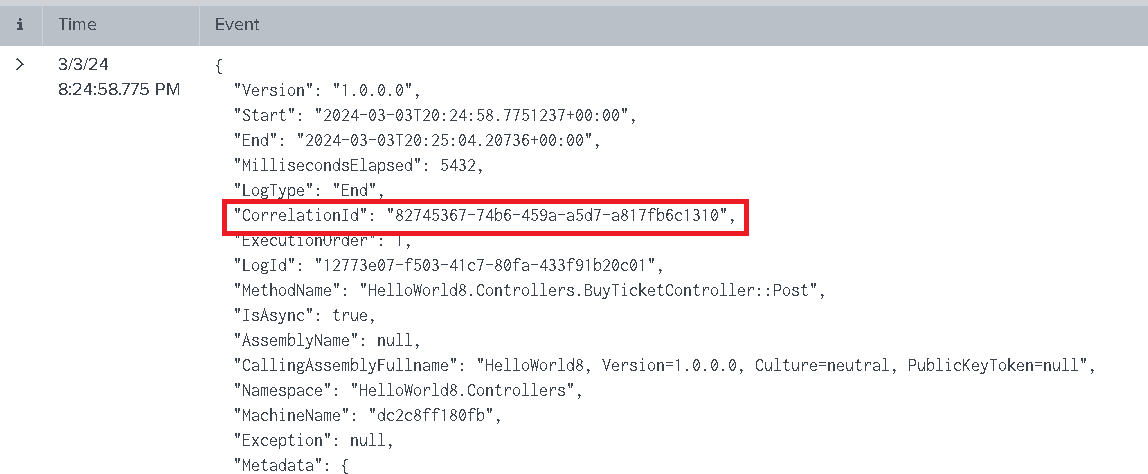
This query example will help identify the top 10 API endpoints with the longest response times, providing critical insights into areas that may need optimization for better performance.


By following this guide, developers and IT professionals can leverage the powerful combination of Splunk and Razorsharp to enhance the observability and security of their .NET applications. For more detailed instructions and advanced configurations, refer to our official documentation.